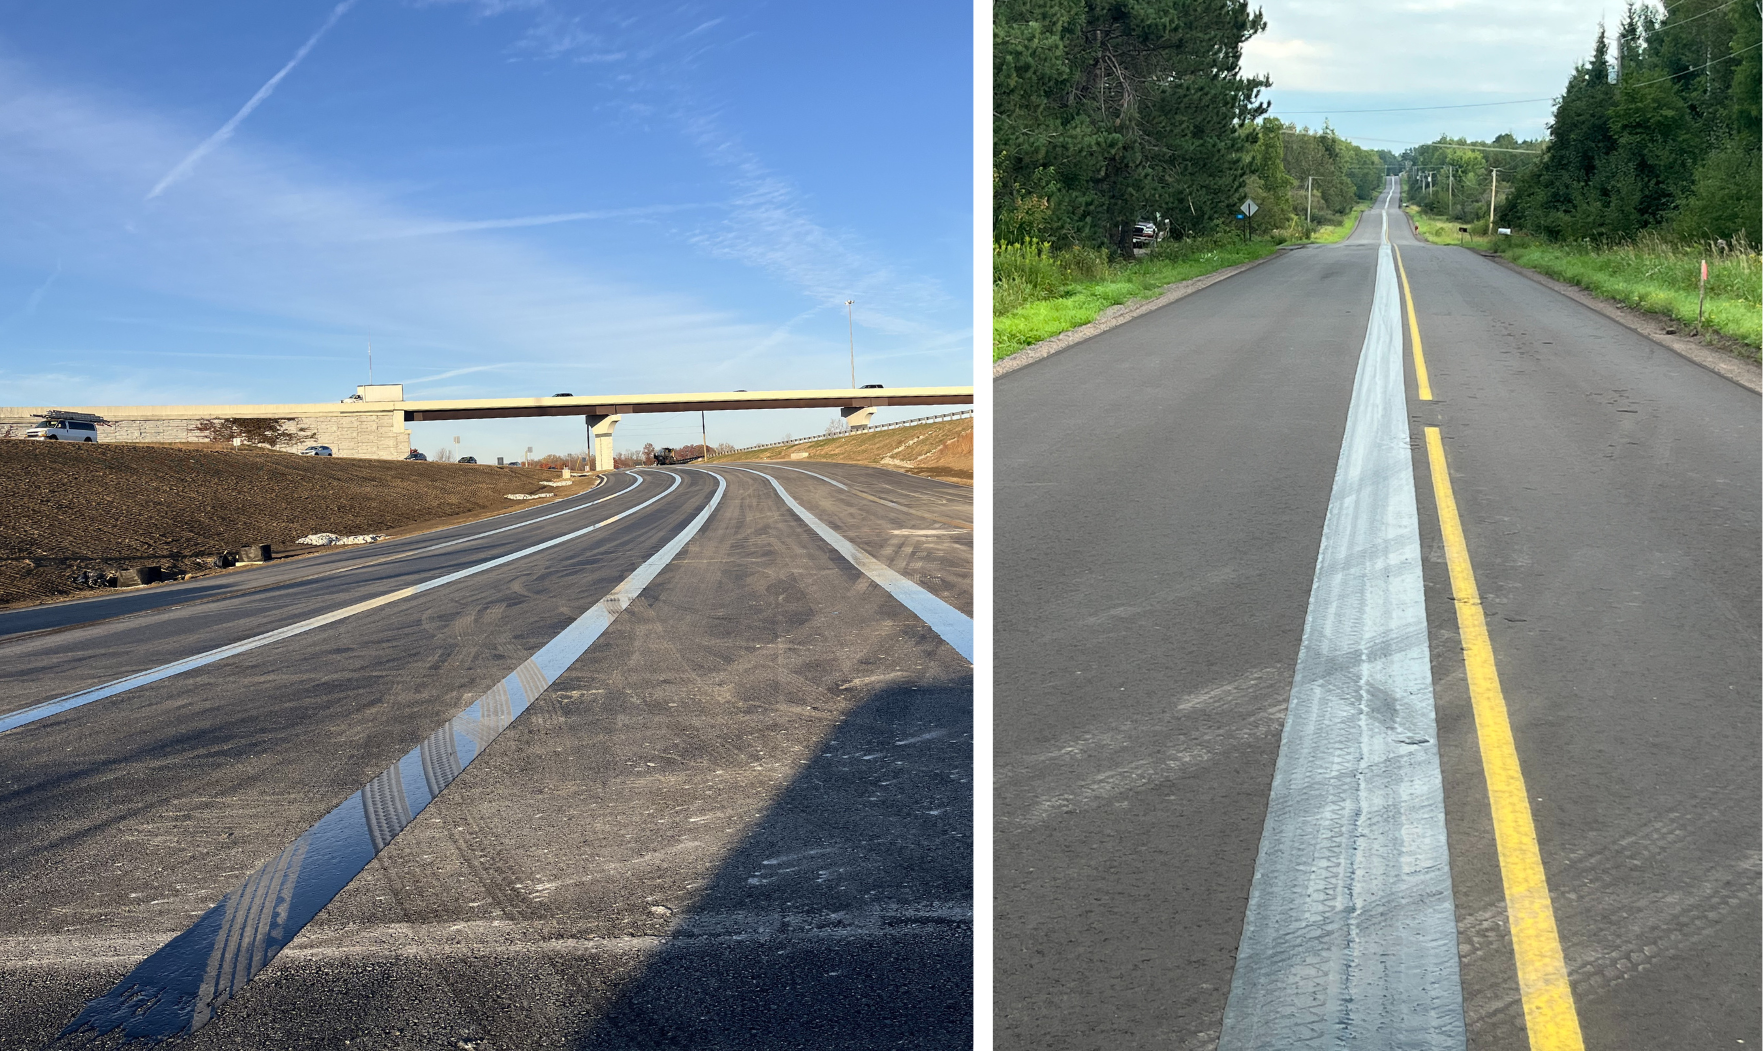
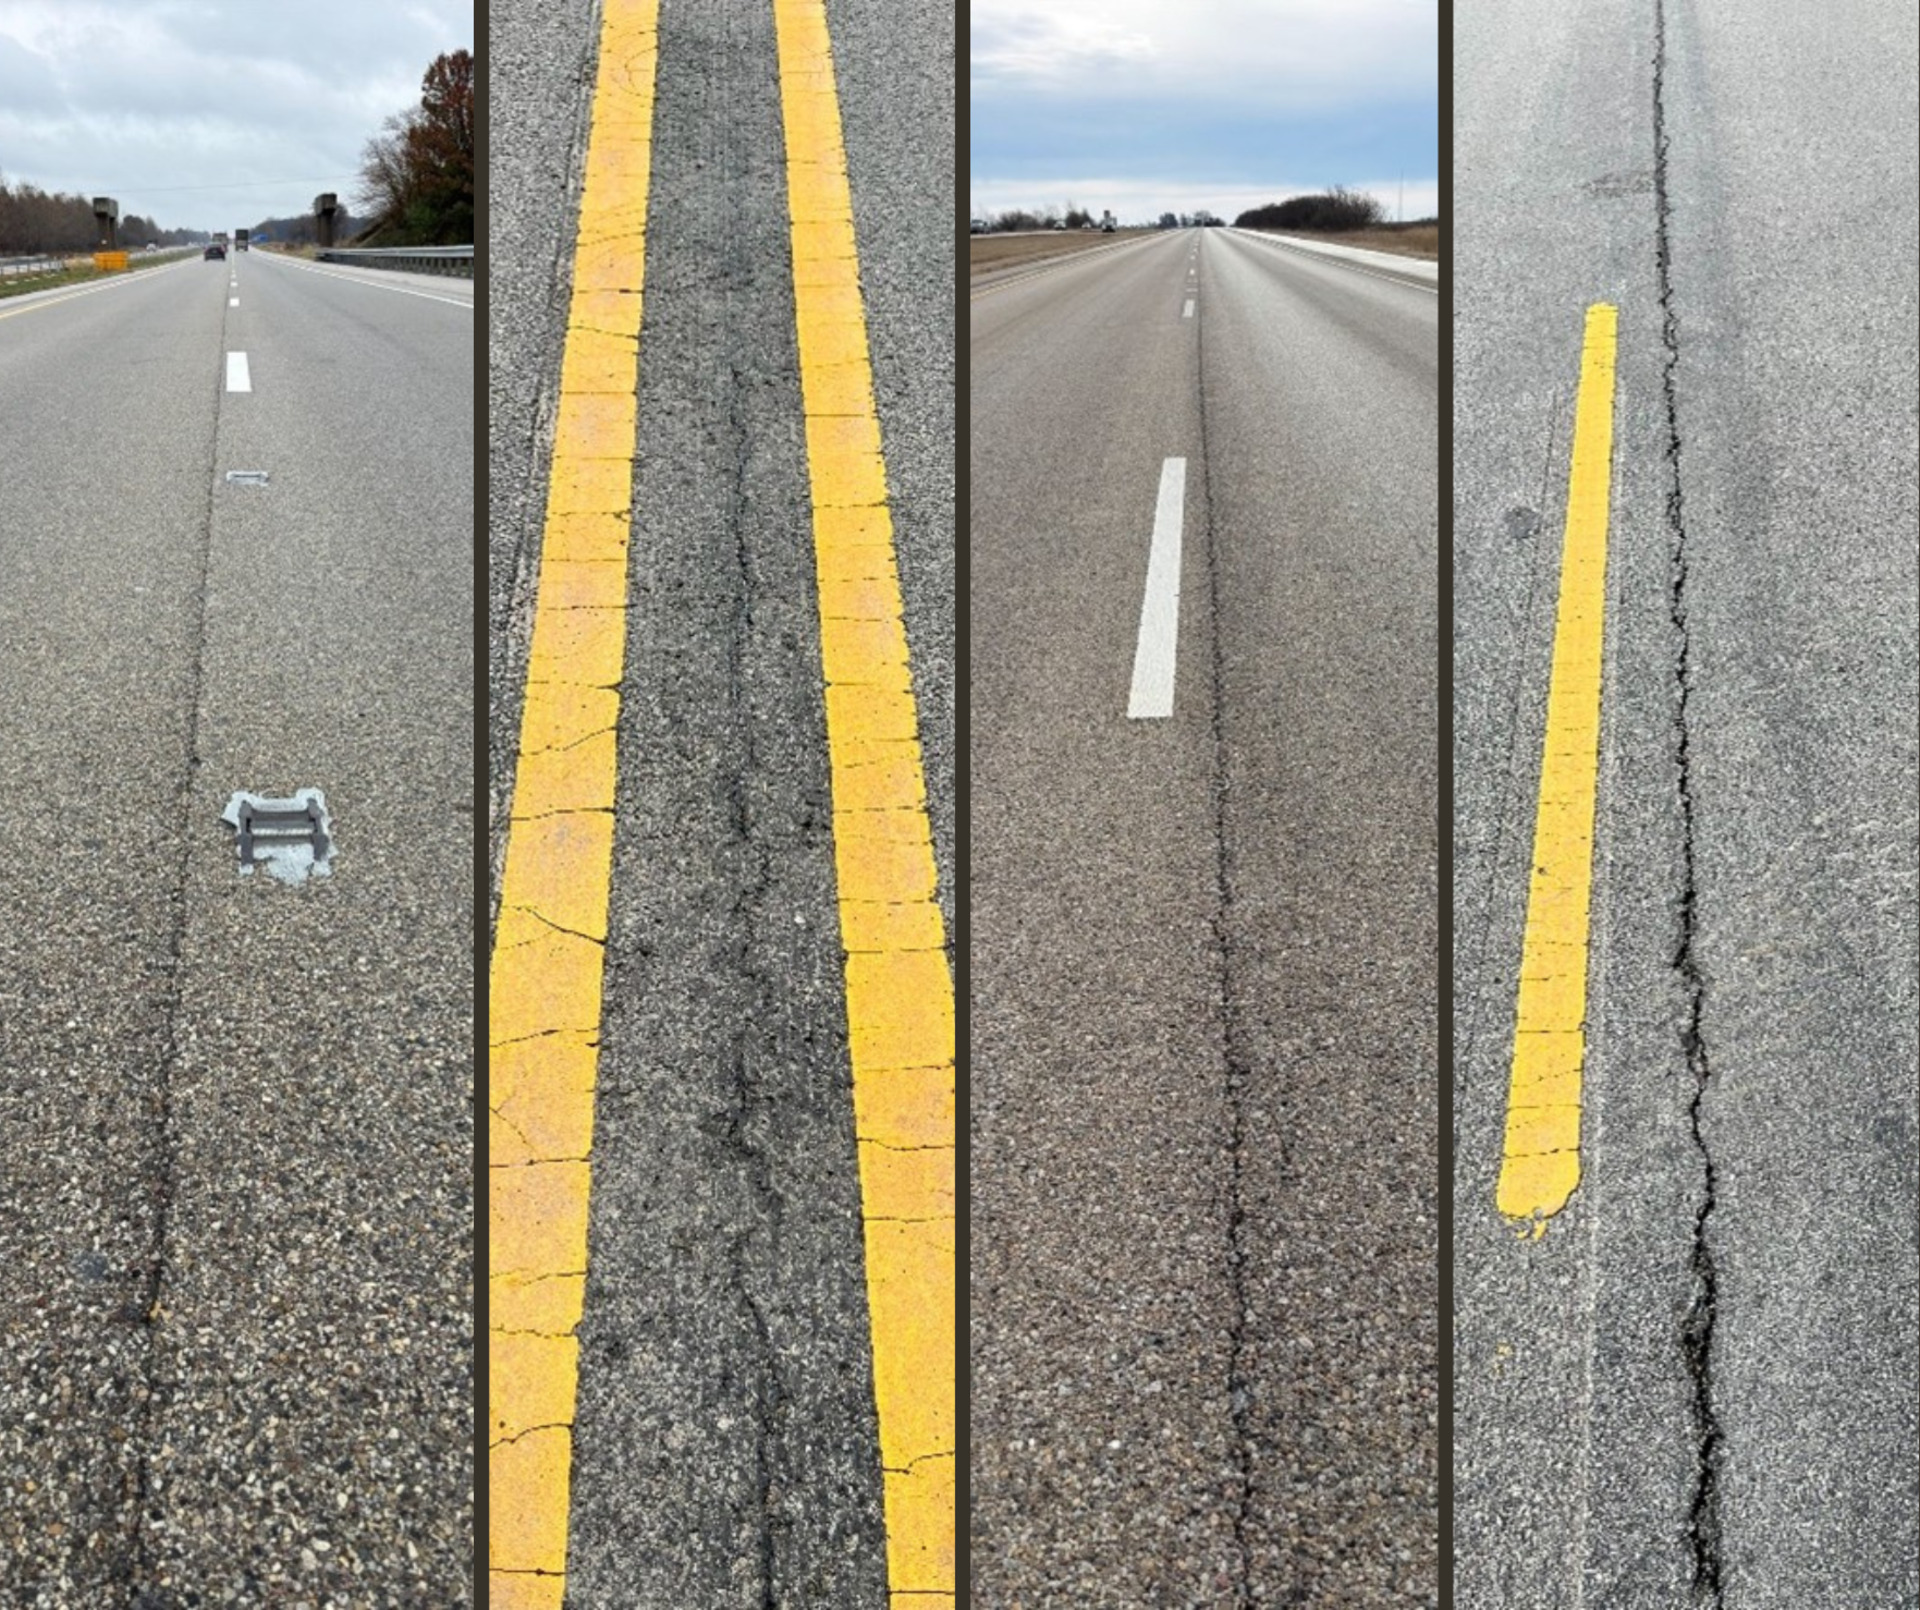
Pavement performance is closely tied to density, which measures compaction. Achieving high density at the longitudinal joint has always been challenging. Another way to evaluate density is through permeability: the denser the pavement, the less water can infiltrate. Water intrusion is a leading cause of early pavement failure, especially at longitudinal asphalt joints and rumble strips. Keeping water out of these areas significantly extends pavement life.
A Proven Solution to Reduce Permeability
As a smart pre-preservation treatment for longitudinal joints, VRAM is applied under the joint in order to achieve nearly zero permeability of the surface course.
VRAM (Void Reducing Asphalt Membrane) is a polymer-modified asphalt used to extend the life of the longitudinal joint area, and by extension, the entire pavement. It is applied under the joint before surface course paving, where it migrates up to fill the interconnected air voids, sealing the joint area and making it nearly impermeable to water.
Context: The Research Behind Pavement Permeability
Research confirms that permeable pavements allow water to enter voids, causing moisture damage, while air infiltration accelerates binder aging and leads to cracking (Cooley et al.).
Air Void and Permeability Thresholds
Pennsylvania State University PennDOT Study (Solaimanian)
- For 12.5-mm NMAS mixes, permeability rises sharply when air voids exceed 7–8%
- For 9.5-mm NMAS mixes, the threshold is 8%
- Suggested field permeability limit: 150 × 10⁻5 cm/s
NCAT Report 01-03 (Cooley et al.)
- Critical permeability limit: 100 × 10⁻5 cm/s for Superpave coarse-graded mixes (≈92.3% density)
Oklahoma State University ODOT Study (Cross & Bhusal)
- Permeability increases when voids exceed 8%, and drastically above 10%
- Critical void contents: 10–12% (≈88–90% compaction)
Why focus on Pavement Permeability?
Permeability is the most accurate way to measure water intrusion risk, but it is not practical to use on construction sites because it is harder and slower to test compared to density. Instead, air voids (density) are used as a proxy since higher air voids correlate with higher permeability, although this is not a linear relationship.
The challenge: even when target air void levels are known, they are not always specified or achieved, leaving pavements vulnerable to moisture damage and cracking (R. West et al. NRRA).
Measuring Pavement Permeability
There are two common methods for determining pavement permeability:
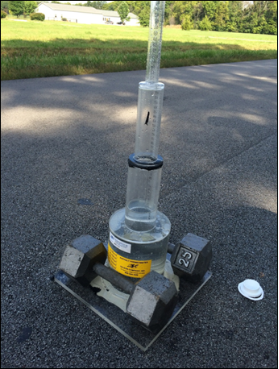
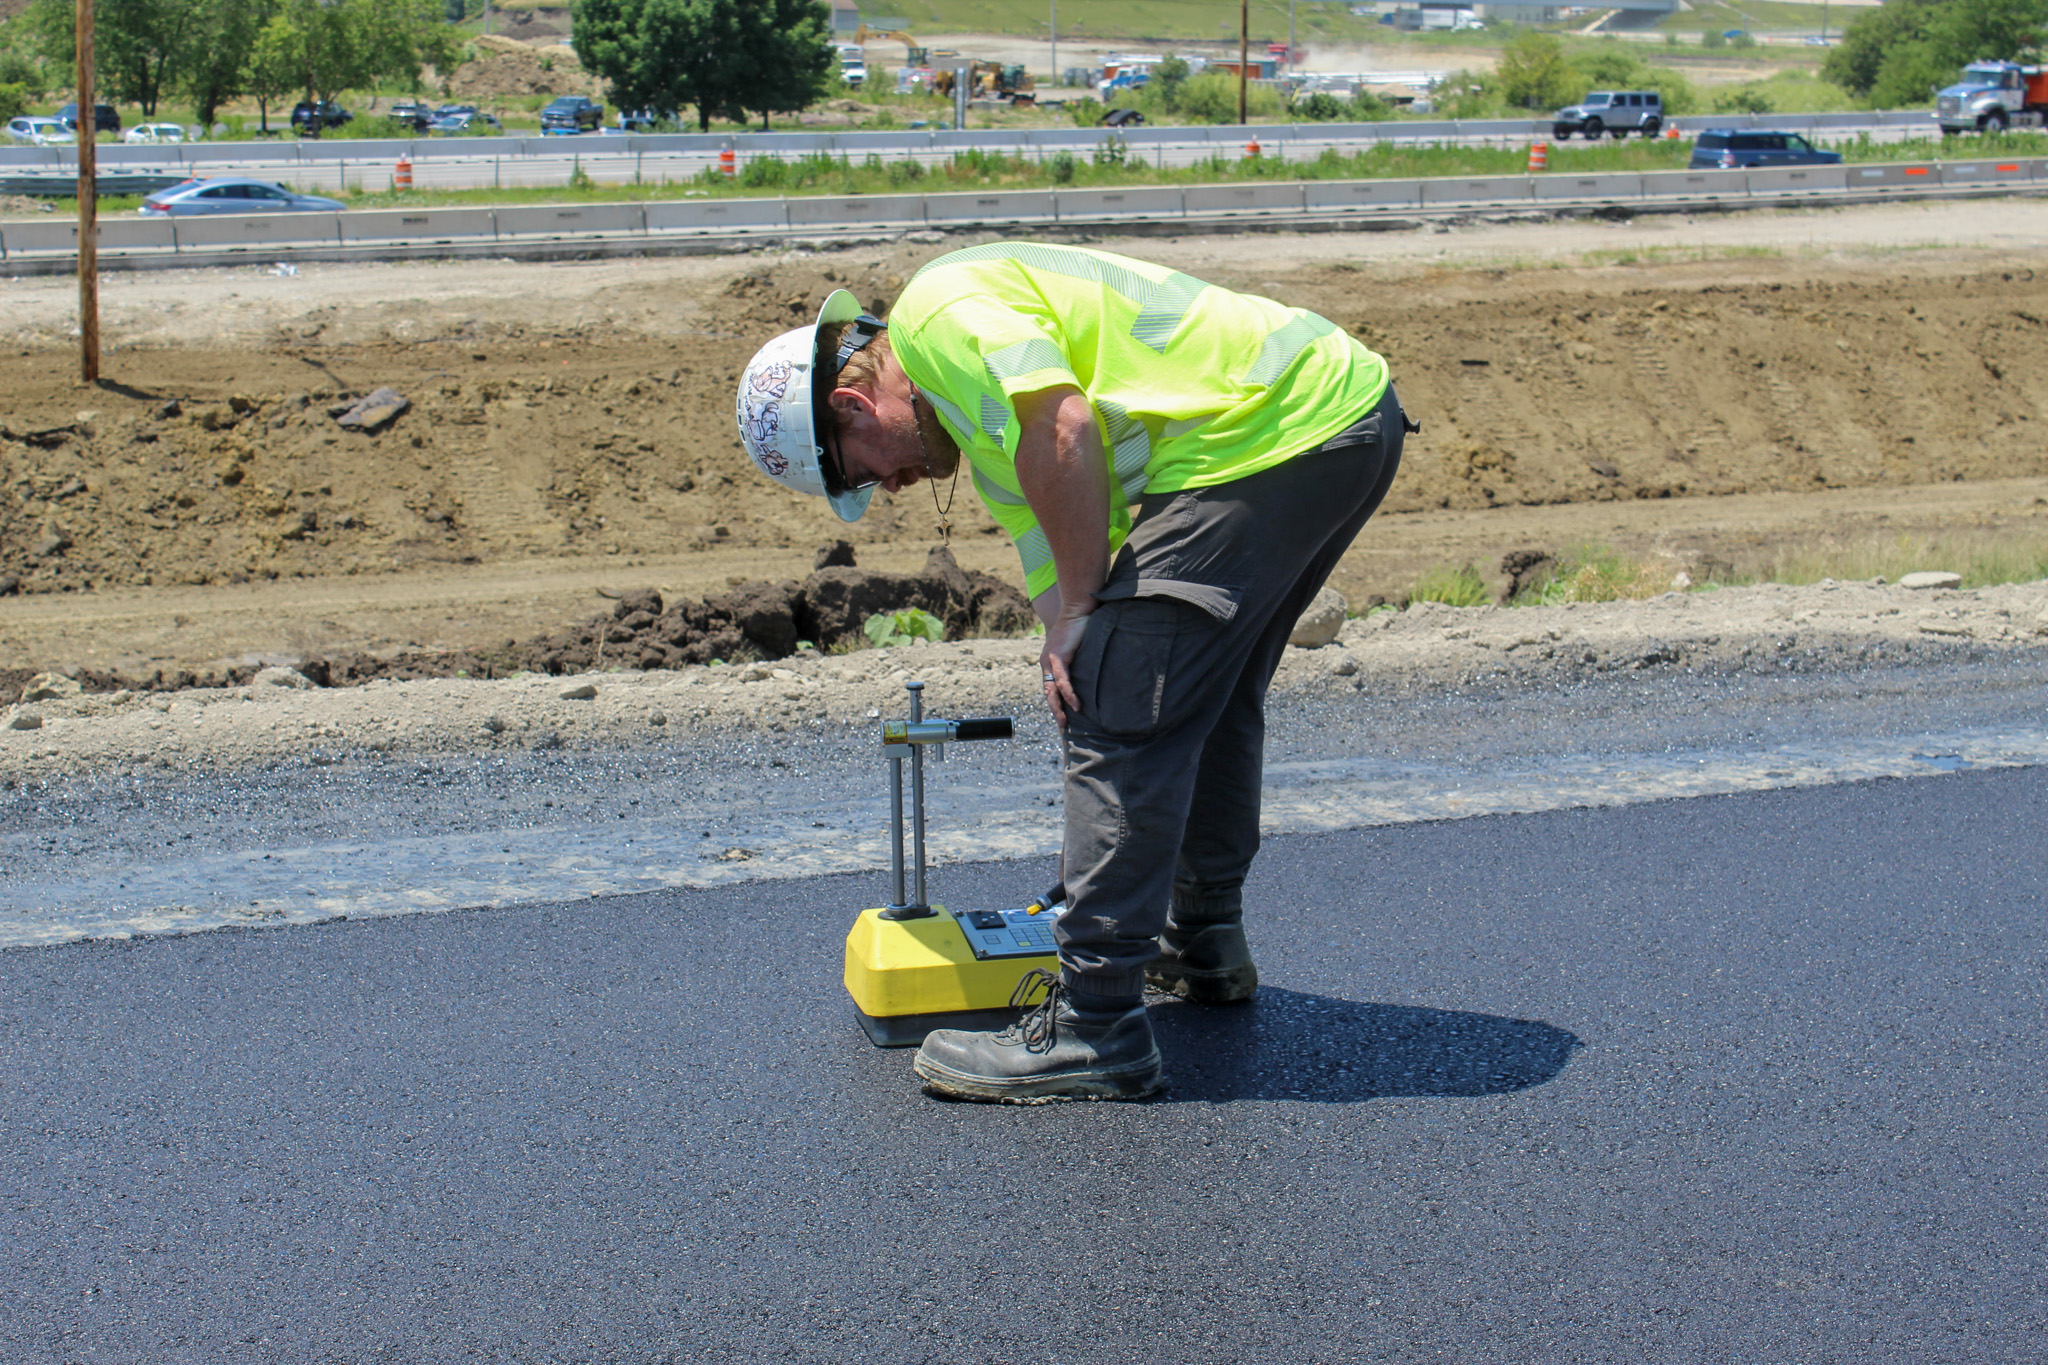
1. Falling Head Field Permeameter
In the field, the base of the permeameter is sealed to the pavement using putty, and the apparatus is held down with weights. Water is then poured into the top of the tube until it is filled. The tube has markings to measure the rate of water flow. The faster the water flows through the pavement, the higher the permeability.
This type of field testing is non-destructive and convenient, yet the results may be misleading under certain circumstances. Water flows in the path of least resistance, which is sometimes lateral flow, and not just vertical. Because VRAM creates an impermeable layer to vertical flow, water will tend to flow laterally (and upward outside the permeameter area), resulting in measurable permeability. When water is escaping horizontally, the results may not be representative of the full depth of the pavement. Field falling head permeameter testing results can also vary between different mix types (e.g. fine vs. coarse-graded) and environmental variables.
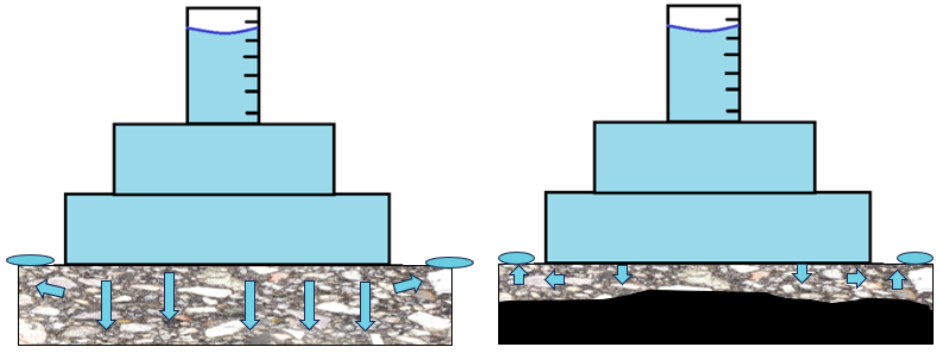
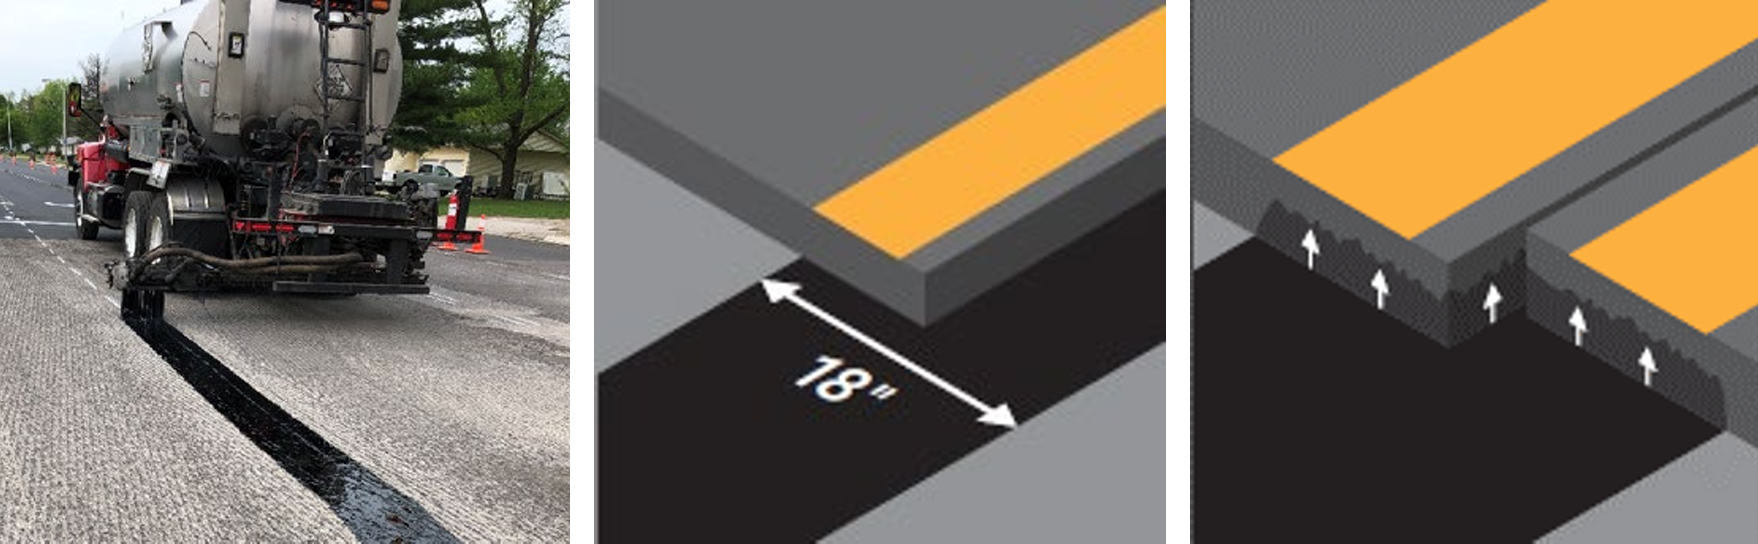
Diagram of the flow of water from a field falling head permeameter. On the left, water flows through the interconnected air void on an untreated mix. On the right, water cannot pass the VRAM barrier but still flows laterally.
2. Falling Head Lab Permeameter
While a core must be cut and brought back for testing, the results are often more accurate and consistent. In a sealed and controlled testing environment, the full permeability of a core can be tested, ensuring only vertical water flow.
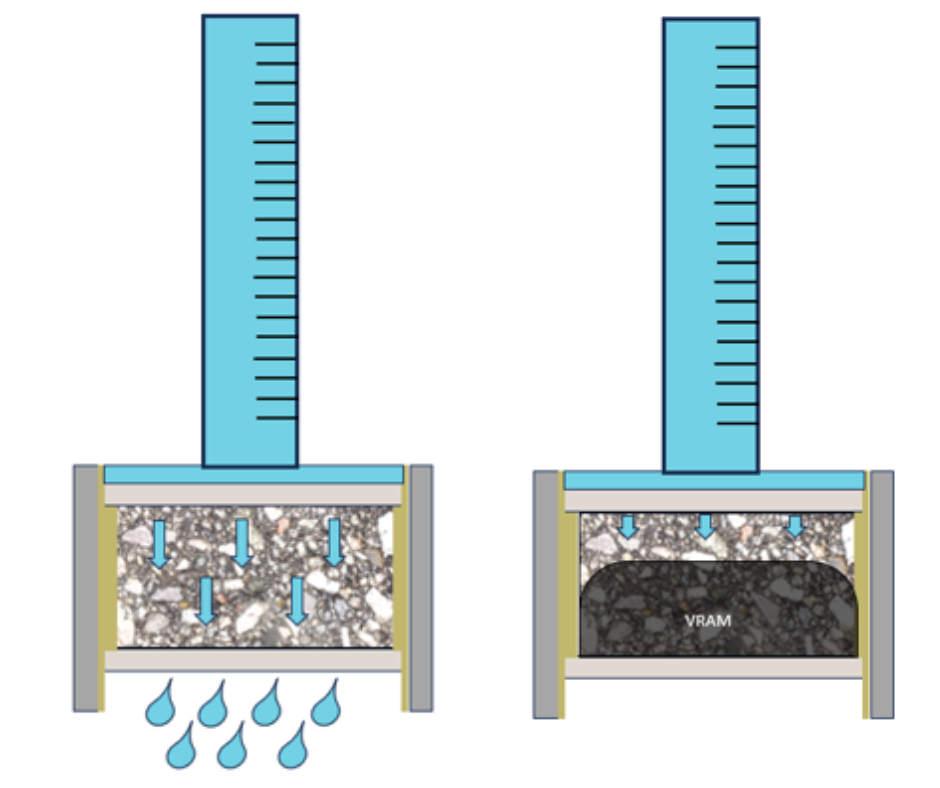
Diagram shows a lab falling head permeameter where lateral (horizontal) water flow is prohibited by the testing device. On the left, water flows through interconnected voids of an untreated mix. On the right, VRAM creates an impermeable barrier.
Testing VRAM’s Effectiveness
Lab testing consistently shows that VRAM-treated cores have zero or near-zero permeability. Unlike field tests, which can be skewed by lateral flow, lab testing isolates vertical flow and demonstrates VRAM’s ability to block water movement through the joint.
This 2022 Transportation Research Board (TRB) study by DeCarlo et al. highlights the discrepancy between field and lab permeability measurements.
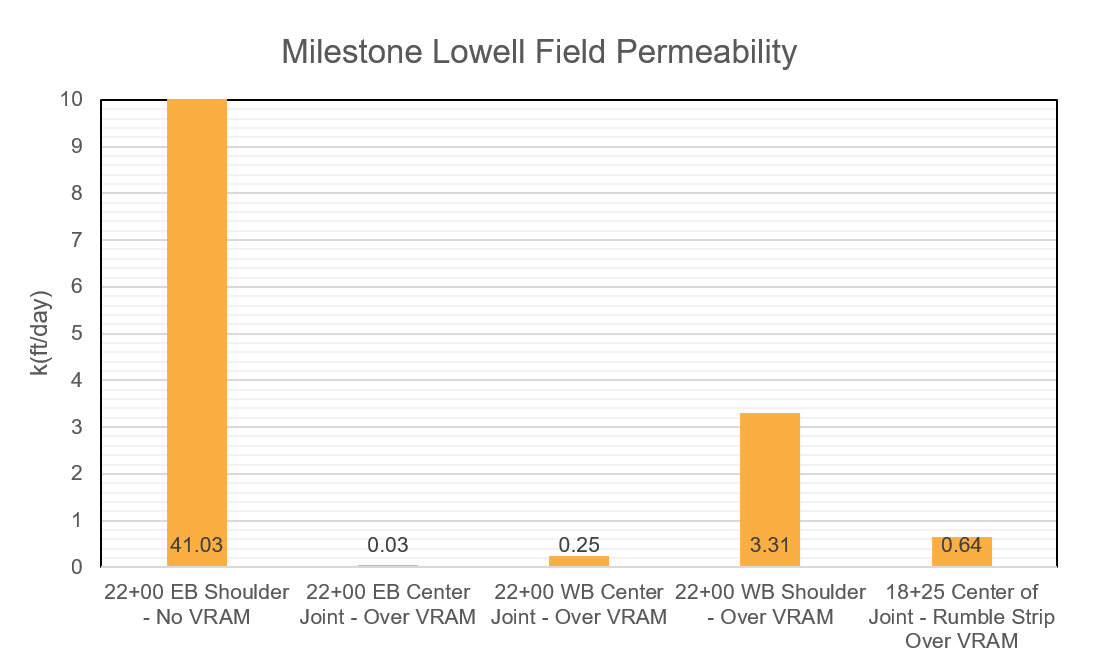
These two charts compare the permeability of the same test project through lab and field falling head permeator testing. Top – Lab. Bottom – Field.
- Lab: VRAM sections were effectively impermeable.
- Field: Some permeability appeared due to lateral flow, but VRAM still performed dramatically better than control sections.
Long-Term Performance Evidence
In 2020, a TRB study by Trepanier et al., showed that VRAM lowers permeability by migrating upward in the pavement to fill air voids and create an impermeable barrier, resulting in increased crack resistance.
Early Studies
- Between 2001 and 2003, test sections were built to evaluate VRAM, known then as Longitudinal Joint Sealant (LJS) in Illinois.
- Immediately after construction, field and lab tests showed that VRAM sections had zero vertical permeability, meaning water could not penetrate below the surface.
- In most cases, in-place permeability was cut in half compared to control sections.
12-Year Review
- IDOT found that joints with VRAM performed significantly better than control sections and were in similar or better condition than the rest of the pavement.
- Lab tests confirmed lower permeability and higher crack resistance near VRAM joints.
- VRAM treatment extends joint life by 3–5 years and delivers a benefit 3–5 times its initial cost.
16-Year Review
- Whole cores showed VRAM sections had 3% higher overall density than controls, with the bottom half averaging 5% higher density.
- Lab tests confirmed zero permeability in the bottom half of VRAM cores, while control cores ranged from 110 to 372 × 10⁻⁵ cm/sec.
- Asphalt content in VRAM cores was much higher—about double that of control sections—especially in the bottom half.
- Digital imaging showed VRAM migrated 10–25 mm into the mix (26–66% of the surface layer). Note: newer formulations and applications achieve 50–75% migration.
Additional Benefits: Cracking Resistance
Illinois Flexibility Index Test (I-FIT) results showed major improvements with VRAM. For example:
- One 15-year-old project: FI = 0.2 (control) vs. 9.0 and 1.9 (VRAM).
- Another: FI = 0.8 (control) vs. 21.1 and 23.3 (VRAM).
(IDOT requires FI ≥ 8.0 for new HMA and ≥ 4.0 for aged HMA.)
Recent Research
A 2022 study from the CAIT Institute at Rutgers University examined the permeability of field cores from the Pennsylvania Turnpike in the lab. Bennert et al. determined that the control cores were 24 times more permeable than the VRAM cores.
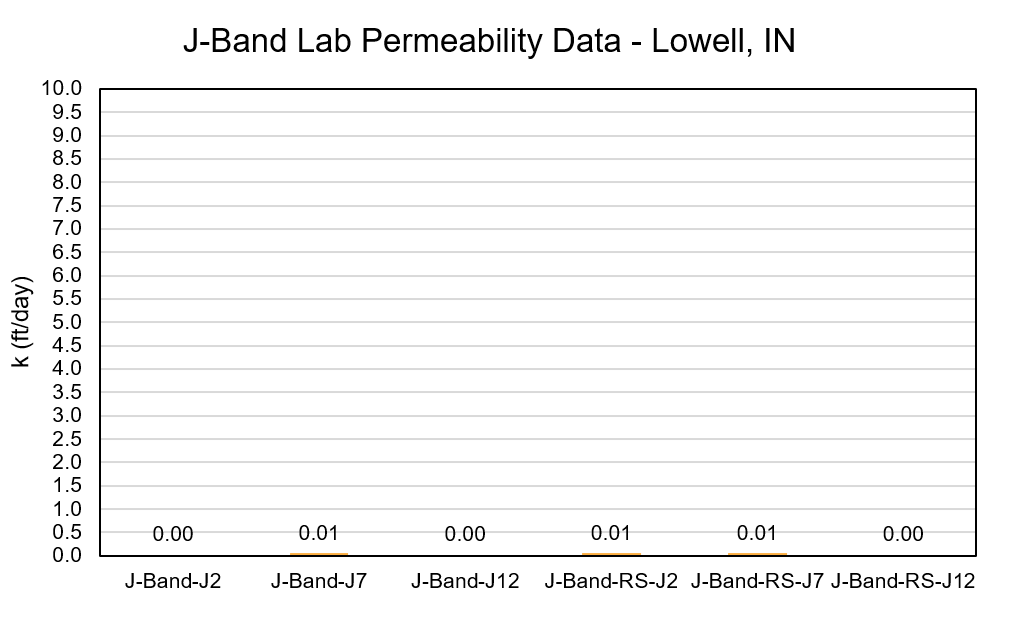
Falling Head Lab Parameter Results: Full Core Permeability
Control Section Joint Area Cores vs. VRAM Test Section Joint Area Cores
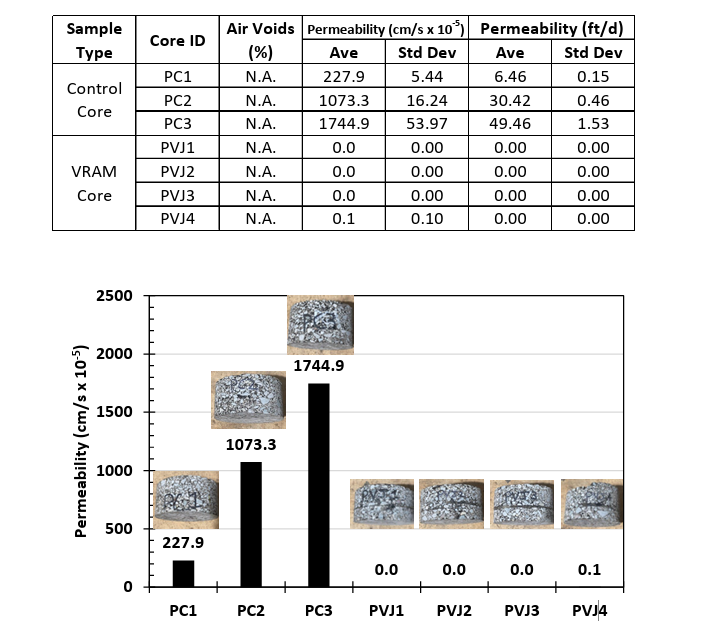
These figures show the permeability measurements of whole field cores from the VRAM joint area vs. control area, displaying how the VRAM seals off the 19mm HMA and does not allow water to permeate past the 12.5mm SMA surface layer.
Permeability testing proves that VRAM effectively seals longitudinal joints, reducing water intrusion and extending pavement life. Backed by decades of research and field performance, VRAM offers a cost-effective solution for improving durability and reducing maintenance needs.
Want to learn more?
- Find out how density testing can be waived at the longitudinal joint. Read here.
- Reach out to our team with any questions! jbandinfo@thgrp.com
References
Bennert, T., Ph. D., Hass, E., M. S., Wass, E., & Tulanowski, D. Evaluation of “J-band” Longitudinal Joint Sealant on Pennsylvania Turnpike MP 94-99 (Western Pa). Rutgers University. CAIT Center for Advanced Infrastructure & Transportation. 2022. https://thejointsolution.com/wp-content/uploads/2022/11/Final-Report-Lab-Testing-of-Field-Cores-from-PATP-MP94-to-98-T-094.00....pdf
DeCarlo, K., Thomas, T., & Wielinski, J. Impact of Rumble Strips on Longitudinal Joint Pavement Performance. Transportation Research Board. The Heritage Group. 2022. https://thejointsolution.com/wp-content/uploads/2024/02/TRB-2023-Rumblestrips-Poster-and-Paper.pdf
L. A. Cooley, Jr., E. R. Brown, S. Maghsoodloo. Development of Critical Field Permeability and Pavement Density Values for Coarse-Graded Superpave Pavements, NCAT Report 01-03. National Center for Asphalt Technology, Auburn University, AL, 2001.
M. Solaimanian. Correlation of Laboratory-Compacted and Field-Compacted Hot-Mix Asphalt Permeability, Project No. 060704. Pennsylvania State University, State College, PA, 2010.
R. West, E. Dave, J. Trepanier, E. Johnson, T. Clyne, B. Brever, J. Garrity, Z. You, C. Turgeon, J. 14 Korzilius. Alternative Joint Construction Techniques. National Road Research Alliance (NRRA), 2018.
S. A. Cross and S. Bhusal. Longitudinal Joint Density and Permeability in Asphalt Concrete, FHWA-OK-08-07, ODOT SPR Item Number 2197. Oklahoma State University, Stillwater, OK, 2009.
Trepanier, J., Senger, J., Thomas, T., & Exline, M. A Materials Approach to Improving Asphalt Pavement Longitudinal Joint Performance. Transportation Research Board. 2020. https://thejointsolution.com/wp-content/uploads/2021/07/2021TRB_Poster_Paper_Combined.pdf